
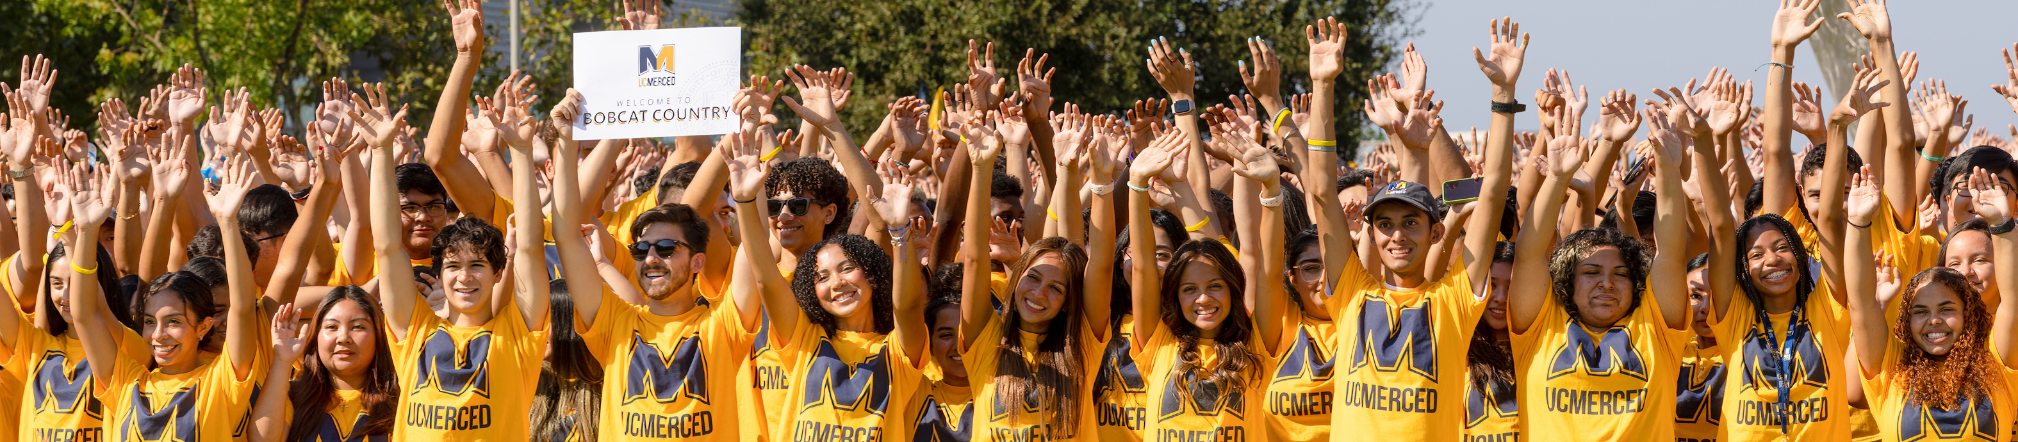
Banner featuring the Chancellor's Belonging Initiatives Grant Program and the EJIE 2025–26 Impact Report.
Chancellor’s Belonging Initiatives Grant Program

This funding will support projects that strengthen belonging, inclusion, and community across the university.  Projects reflecting humanities or the promotion of student well-being are encouraged.

EJIE 2025-26 IMPACT REPORT
Programs by Focus Area
Education & Training
35
Community Building
21
Campus Climate
11
Cultural Awareness
11
Subscribe to Division of Equity, Justice, & Inclusive Excellence RSS

Mission Statement

The Division of Equity, Justice, & Inclusive Excellence builds community and capacity by promoting a model of shared responsibility for equity and inclusion, and providing education, resources, and partnership.

Vision

A campus community that both cultivates the well-being of its members and achieves excellence in learning, discovery, and service by intentionally honoring and welcoming diverse contributions and perspectives.

Values

Collaboration — working together with common purpose
Respect — treating all persons with dignity
Action — making it real
Fairness — ensuring equity in process and outcomes for all persons
Transparency — providing clarity in communication and goals

Bobcat Profiles: Students, Staff, and Faculty

Demographic profiles of UC Merced students, staff, and faculty. Data shown include gender, Underrepresented Minority (URM) status, and race and ethnicity.

Underrepresented Minority (URM)

In alignment with University of California practices, “underrepresented minorities” (or URM) refers to three categories that are underrepresented overall among students in higher education: African American, Hispanic (Chicano/Latino) and Native American (American Indian)

Undergraduate Students (2026)

Gender

Male, 52.6 percent; Female, 43.8 percent; Unknown/Declined to State, 3.6 percent. Total population: 8,981.8,981students
  • Male: 52.6% (4,721)
  • Female: 43.8% (3,930)
  • Unknown/Declined to State: 3.6% (330)

Underrepresented Minority Status

Underrepresented Minority (URM), 64.8 percent; Non-Underrepresented Minority (Non-URM), 34.3 percent; Unknown/Declined to State, 0.9 percent. Total population: 8,981.8,981students
  • Underrepresented Minority (URM): 64.8% (5,819)
  • Non-Underrepresented Minority (Non-URM): 34.3% (3,082)
  • Unknown/Declined to State: 0.9% (80)

Staff (2024)

Gender

Male, 37.0 percent; Female, 55.5 percent; Unknown/Declined to State, 7.5 percent. Total population: 1,541.1,541staff
  • Male: 37.0% (571)
  • Female: 55.5% (855)
  • Unknown/Declined to State: 7.5% (115)

Underrepresented Minority Status

Underrepresented Minority (URM), 49.2 percent; Non-Underrepresented Minority (Non-URM), 43.5 percent; Unknown/Declined to State, 7.3 percent. Total population: 1,541.1,541staff
  • Underrepresented Minority (URM): 49.2% (758)
  • Non-Underrepresented Minority (Non-URM): 43.5% (671)
  • Unknown/Declined to State: 7.3% (112)

Faculty (2024)

Gender

Male, 49.8 percent; Female, 41.3 percent; Unknown/Declined to State, 8.9 percent. Total population: 462.462faculty
  • Male: 49.8% (230)
  • Female: 41.3% (191)
  • Unknown/Declined to State: 8.9% (41)

Underrepresented Minority Status

Underrepresented Minority (URM), 18.0 percent; Non-Underrepresented Minority (Non-URM), 76.2 percent; Unknown/Declined to State, 5.8 percent. Total population: 462.462faculty
  • Underrepresented Minority (URM): 18.0% (83)
  • Non-Underrepresented Minority (Non-URM): 76.2% (352)
  • Unknown/Declined to State: 5.8% (27)

Race and Ethnicity Comparison

Reported race and ethnicity percentages by population.

Race and ethnicity percentages. Counts shown in parentheses.
Race or Ethnicity Category Students (8,981) Staff (1,541) Faculty (462)
Hispanic/Latino 59.5% (5,343) 44.1% (680) 14.1% (65)
Asian 19.7% (1,766) 10% (154) 17.5% (81)
White 8.5% (765) 27.5% (424) 51.9% (240)
African American/Black 4.9% (440) 4.5% (70) 3.2% (15)
Two or More Races/Multi-Racial 4.9% (436) 5.8% (89) 2.8% (13)
International 1.3% (115) 0.3% (4) 3.9% (18)
American Indian/Alaska Native 0.2% (20) 0.5% (8) 0.6% (3)
Pacific Islander 0.2% (16) Not separately reported Not separately reported
Unknown/Declined to State 0.9% (80) 7.3% (112) 5.8% (27)

Percentages are rounded to one decimal place. Totals may not equal exactly 100.0% because of rounding. “Not separately reported” indicates that the source data did not provide a separate category value for that population.

You Belong at UC Merced

All offerings described here are open to everyone, in alignment with state and federal law and the University of California’s nondiscrimination policies. We are dedicated to creating an environment where all students, staff, and faculty feel welcomed, supported, and empowered to thrive. To learn more, please visit the UC Nondiscrimination Statement or the Nondiscrimination Policy Statement for University of California Publications Regarding Student-Related Matters.